Our environmental management
Our production is energy- and resource-intensive. Both through the consumption of natural resources and the use of various chemicals, the topic of environmental protection enjoys a high priority for us.
INDICATORS
With our environmental management system in accordance with the European standard EMAS, we pursue a holistic approach to the topic of the environment.
Developed by the European Community, EMAS covers all relevant environmental aspects. It is also performance-focused: Every certified company should continuously improve its environmental performance – and involve its employees in the process. “EMAS-certified companies make an effective contribution to environmental protection, save costs and show social responsibility. EMAS ensures that all environmental aspects from energy consumption to waste are implemented in a legally secure and transparent manner.” (www.emas.de)
Sub-topics
↓ Our environmental team
↓ Environmental reporting
↓ Environmental aspects
↓ Energy and water management
↓ Wastewater management
↓ Waste management
↓ Biodiversity
→ Not all chemistry is the same?
→ CO2 footprint
→ Our fibre stars
> EMAS
> GRI 102-11
> GRI 102-12
> GRI 102-16
> GRI 103-2
> GRI 103-3
> GRI 307-1
Environmental reporting
As an EMAS-registered and certified company, we are obliged to publish a detailed environmental statement annually. The environmental statement is validated by an environmental appraiser and is an essential part of our environmental management system.
The most important key figures and information can be found on this sustainability page. Our validated environmental statements are available for download here:
Download
Download
Download
Download
OEKO-TEX® STeP
In addition, we have also been certified according to the OEKO-TEX® STeP standard since 2020. This means that the systemic requirements of EMAS are supplemented by content requirements from the OEKO-TEX® STeP standard. This standard contains six different modules: Chemicals Management, Environmental Performance, Environmental Management, Social Responsibility, Quality Management and Health & Safety.

Downloads
↓ EMAS certificate
↓ ISO 14001 certificate
↓ STeP by OEKO-TEX® certificate
↓ Kettelhack Corporate Policy

Responsibility for environmental management lies with Sustainability Manager, Giada Trotta and our Technical Manager, Arthur Kalmbach. This interdisciplinary team ensures that the environmental management system is holistically implemented and fully embraced by all colleagues.
> EMAS
> GRI 102-30
> GRI 102-31
> GRI 103-1
> GRI 303-2
Our environmental aspects
Environmental aspects are all activities, products or services of a company that have an impact on the environment. The identification of direct and indirect environmental aspects is an essential part of any environmental management system. These aspects are recorded, evaluated and reviewed at regular intervals.
> EMAS
> GRI 302-1
> GRI 302-3
> GRI 303-1
> GRI 303-5
> GRI 305-7
Energy and water management

Resource consumption depends on various factors, for example, the grammage and composition of the fabric, colour and finishing requirements, or even batch size. A multitude of product variants, therefore, also stands for a multitude of consumption profiles. For this reason, even a comparison with oneself becomes a challenge. Looking at our production profile is, therefore, essential for interpreting the key figures.
Our production profile
- Output
- Fabric
| 2021/2022 | 2022/2023 | 2023/2024 | |
| Output (m) | 10 595 454 | 9 940 371 | 9 453072 |
| Machine hours | 30 734 | 29 345 | 26313 |
| 2021/2022 | 2022/2023 | 2023/2024 | |
| ∅- Weight in g | 300 | 300 | 300 |
| White share (%) | 33 | 34 | 35 |
| Colour share (%) | 67 | 66 | 65 |
A lot of steam is needed in the dyeing and finishing process. Therefore, our production is energy intensive. The high consumption of energy and water is one of the most important environmental aspects and thus energy and water management is a very important part of the environmental management system. Consumption data are evaluated on a monthly basis – key figures support this evaluation and indicate irregularities at an early stage.
Our Consumption Data
- Energy
- Water
- Emissions
| 2021/2022 | 2022/2023 | 2023/2024 | |
| Electricity kWh | 4 262 650 | 4 111 799 | 3 824 497 |
| Green electricity share | 65,0 % | 69,0 % | 85,5 % |
| Gas kWh | 32 235 240 | 28 296 963 | 25 153 913 |
| Total energy kWh | 36 497 890 | 32 408 762 | 28 978 410 |
| kWh/machine hrs. | 1 187 | 1 111 | 1 101 |
| 2022/2022 | 2022/2023 | 2023/2024 | |
| Well water m3 | 165 758 | 158 444 | 147 895 |
| Municipal water m3 | 2 829 | 2 678 | 2 629 |
| Total water m3 | 168 587 | 161 122 | 150 524 |
| Municipal water share | 1.7 % | 1.66 % | 1.75 % |
| m3/machine hr. | 5.9 | 5.5 | 5.72 |
| 2021/2022 | 2022/2023 | 2023/2024 | |
| Total air emissions in kg | 8 578 | 8 509 | 5 822 |
| Sulphur dioxide | 34 | 33 | 33 |
| Nitric oxide | 2 901 | 2 834 | 2 834 |
| Dust | 20 | 19 | 16 |
| Methane | 5 622 | 5 116 | 2 939 |
| Air emissions/machine hrs. | 0.28 | 0.27 | 0,22 |
“We cover almost 99 % of our water needs with treated well water.”
“Various measures to improve energy efficiency in the last fiscal year will save about 480,000 kWh of energy annually in the future.”
> EMAS
> GRI 303-1
> GRI 303-4
Wastewater management
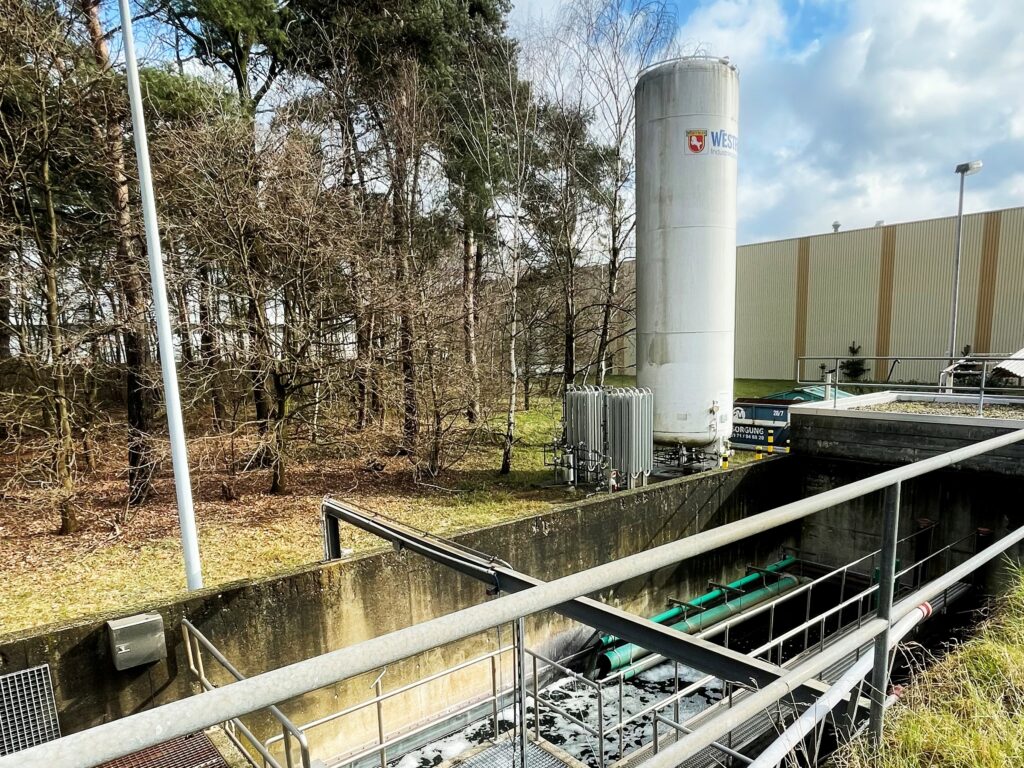
Wastewater management is an important element in our environmental management system. Given the high level of water consumption, wastewater is also the result of production. Compliance with legal requirements from the Wastewater Ordinance is ensured by the daily controlling and checking of the mixing and equalisation basin by trained staff. In addition, there are regular and independent inspections conducted by the responsible monitoring authorities and contracted service providers.
- Wastewater
- Emissions
| 2021/2022 | 2022/2023 | 2023/2024 | |
| Wastewater m3 | 150 917 | 151 042 | 143 905 |
| Wastewater l/running metre | 14.2 | 15.1 | 15.2 |
| 2021/2022 | 2022/2023 | 2023/2024 | |
| Wastewater emissions in kg | 287 989 | 212 142 | 161 037 |
| ∅ Wastewater emissions kg/m3 | 1.78 | 1.41 | 1.12 |
> EMAS
> GRI 306-1
> GRI 306-2
> GRI 306-3
> GRI 306-4
> GRI 306-5
Waste management

Waste is recovered or recycled by authorised and qualified waste disposal companies. Waste types and quantities are recorded in a waste register. In addition to the typical waste types – such as paper, municipal waste or even film – “textile-specific” waste types such as residual solutions, sludge or textile waste are also generated.
Waste summary
| 2021/2022 | 2022/2023 | 2023/2024 | |
|---|---|---|---|
| Total waste | 565 T | 416 T | 290 T |
| Hazardous waste | 23 T | 0,8 T | 0,85 T |
| Hazardous waste per output | 0.20 g/m | 0,08 g/m | 0.09 g/m |
Direct textile recycling
In the production process, textile “waste” accumulates at various points, for example, as offcuts, or in sample production. These remnants are sold directly to a textile recycling company and are, therefore, not officially declared as waste.
| 2021/2022 | 2022/2023 | 2023/2024 |
| 5.61 g/m | 5.74g/m | 6.03 g/m |
> EMAS
> GRI 304-1
> GRI 304-2
> GRI 304-3
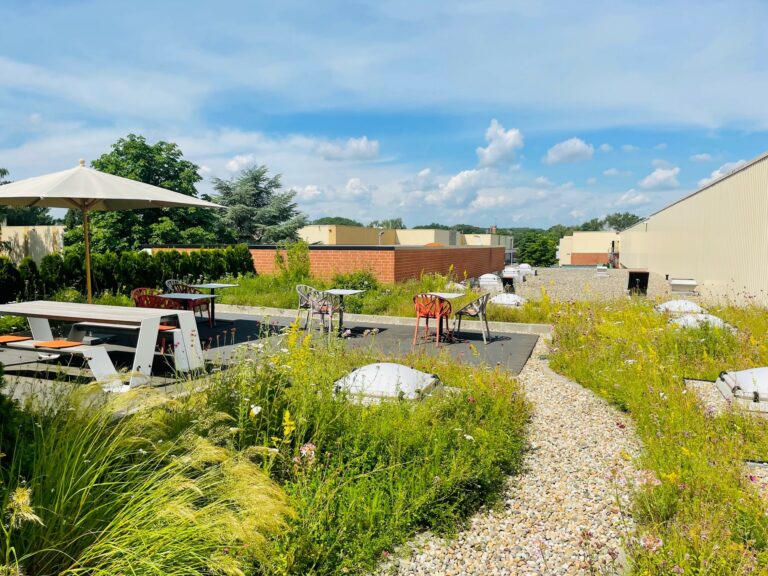
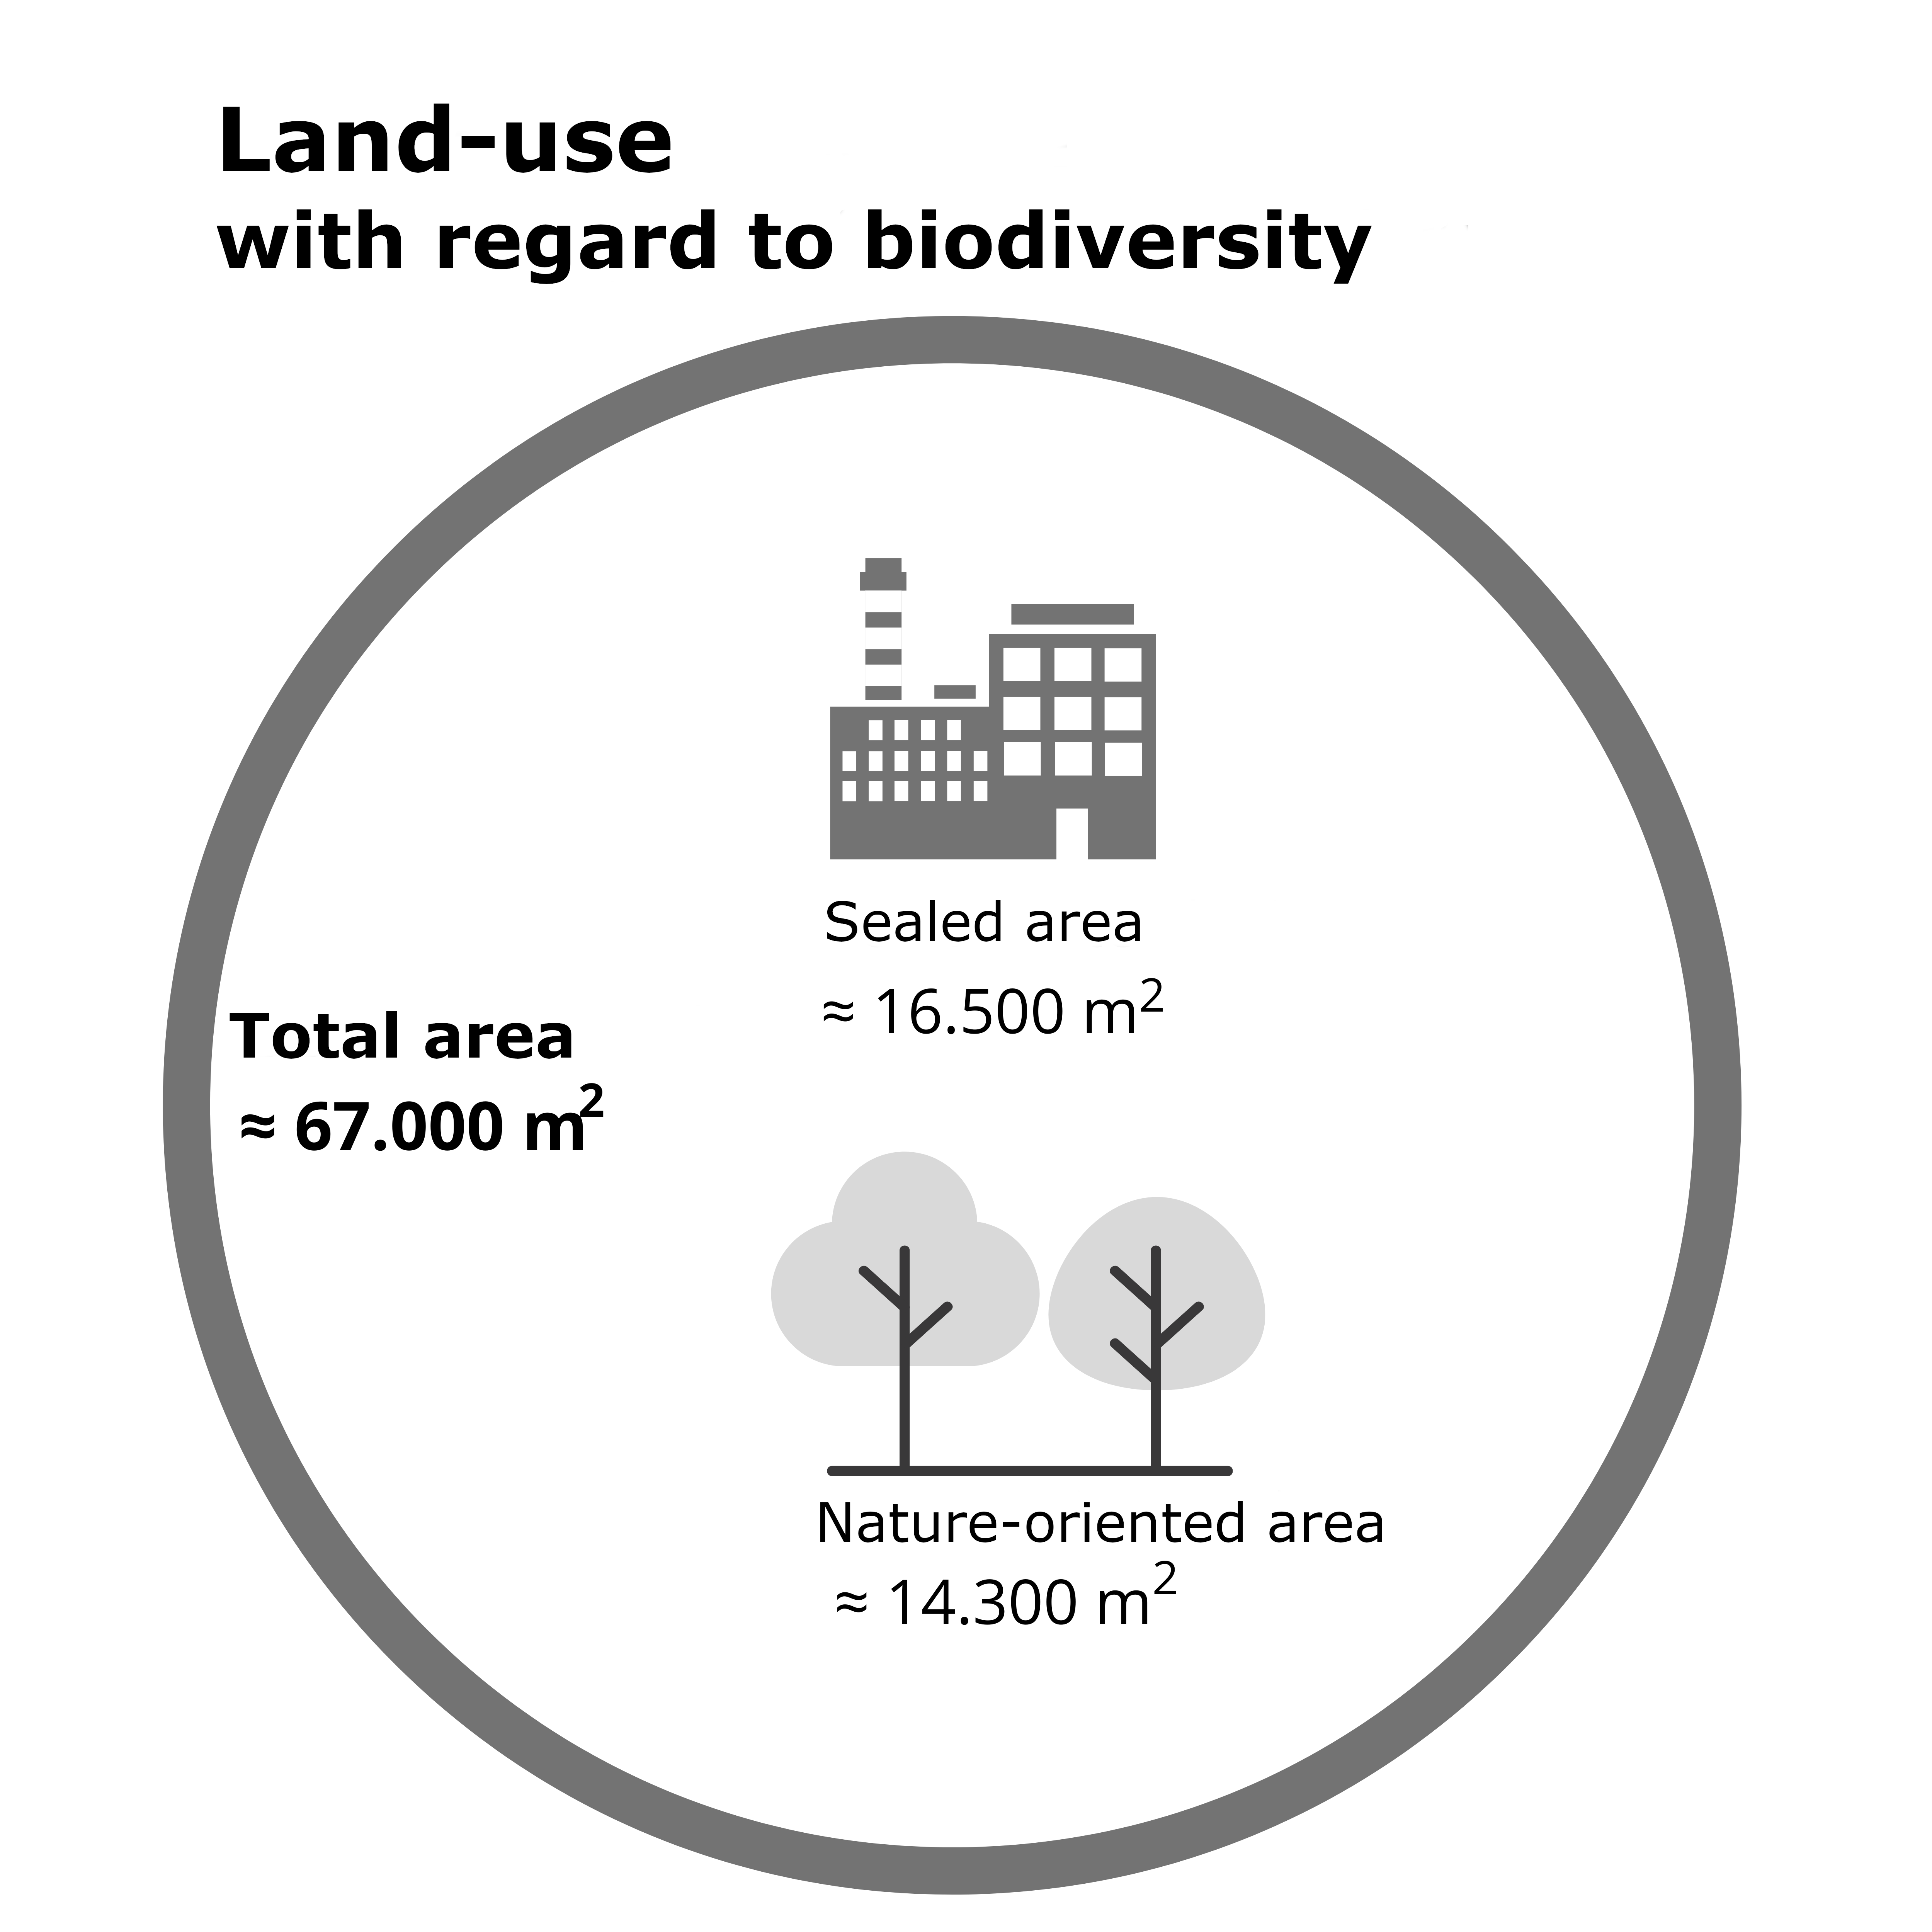
Biodiversity
As a manufacturing company, we depend on an intact ecosystem and on biodiversity, because the use of natural resources (e.g. water) and raw materials (e.g. cotton) is essential for our production processes.
When the company was relocated from the city centre to an industrial site in 1982, part of the forest area was preserved when the company premises were planned. This area of nature on the border to the neighbouring farm is largely left to its own devices. The small forest is home to deer, rabbits, squirrels and various bird species, among others.
On a roof terrace renovated in 2017, the insect-friendly greenery also attracts various butterflies, bees and wasps – from spring through to autumn. Both areas count as “near-natural areas” according to the EMAS definition and serve nature as both a retreat and habitat. The remaining open areas are mainly bushes, shrubs and lawns.
“Germany has committed itself to the protection of biological diversity through both the Convention on Biological Diversity and the Sustainable Development Goals (UN Sustainable Development Goals). This issue is also an important component of environmental protection for German companies.”
Our Kettelhack forest grows by exactly one tree per employee per month!
Since 2018, we have supported the Plant-for-the-Planet project. On behalf of Kettelhack, one tree per employee is planted every month in Campeche (Mexico). As a foundation, the organisation has taken over its own plantation area comprising almost 14,000 hectares of fallow land there, and is reforesting this area with various native tree species. These trees not only store carbon, but also promote local biodiversity. Through our contribution, 1,200 new trees are added every year.
Further articles on the topic

Not all chemistry is the same …
Home Seite Not all chemistry is the same … Without dyes, there can be no coloured,...
Our fibre stars
The high quality and durability of our fabrics already contribute to sustainability. Because the more ...

About this report
The Kettelhack Sustainability Report 2020 was prepared in accordance with the GRI Standard Option 'Core'. ...